CloudMonitor
Get the most out of your multi-vendor resources—computing, networking, storage, cloud, virtual machines (VM), Hyperscalers, containers, databases, and more—with a global view of your hybrid infrastructure.
Book a Demo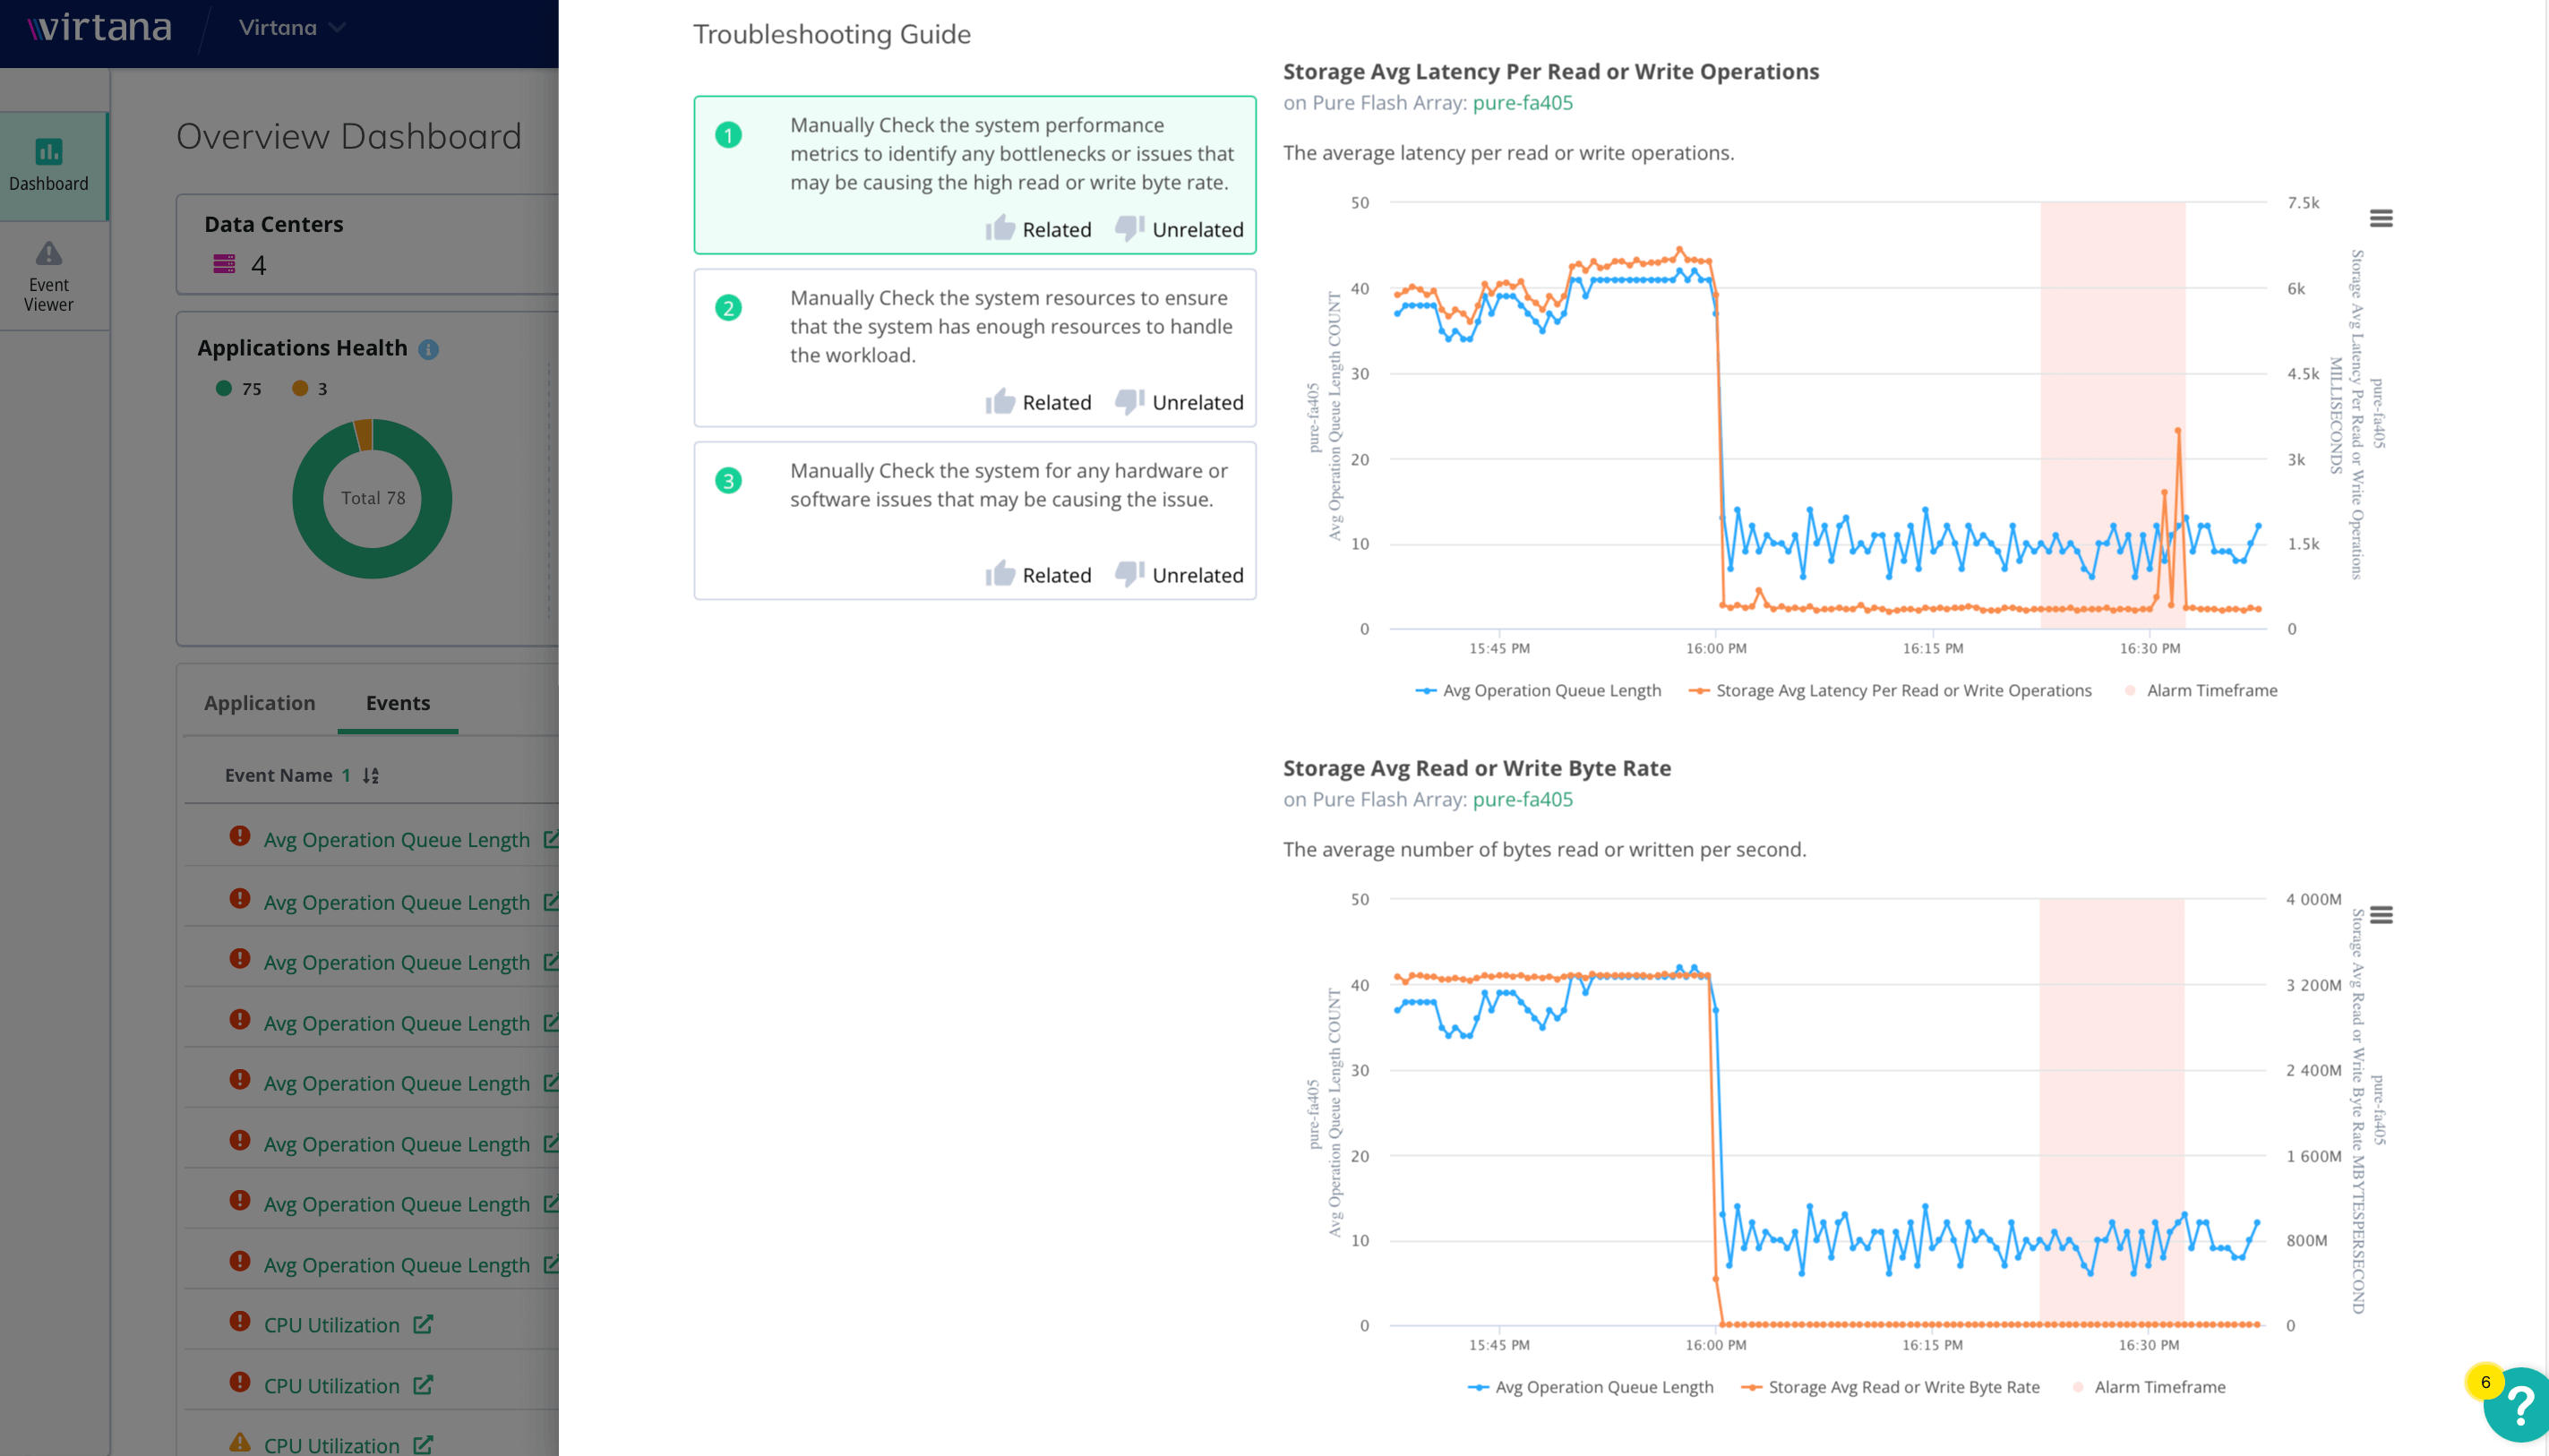
Simplify Hybrid Infrastructure Monitoring
Virtana CloudMonitor enables you to stream data—including usage rates and alarm occurrences for applications—from multiple infrastructure types so you can eliminate individual data silos.
Global Visibility With Automatic Discovery
Get a centralized and panoramic view of your estates by any region, data center, or application for accurate, real-time insights into the health of your overall environment.
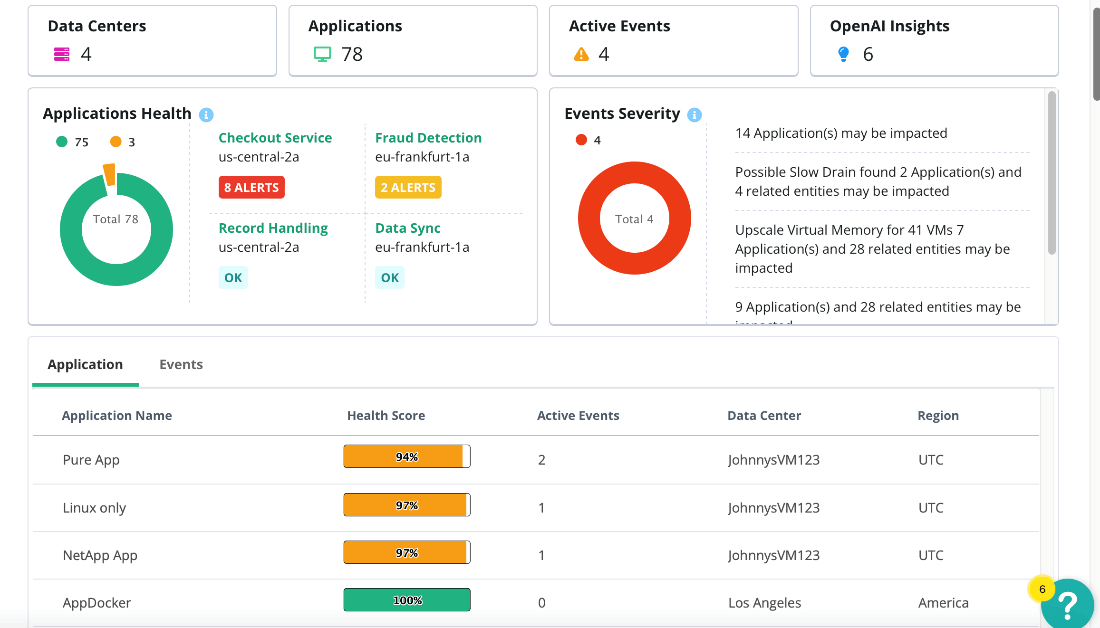
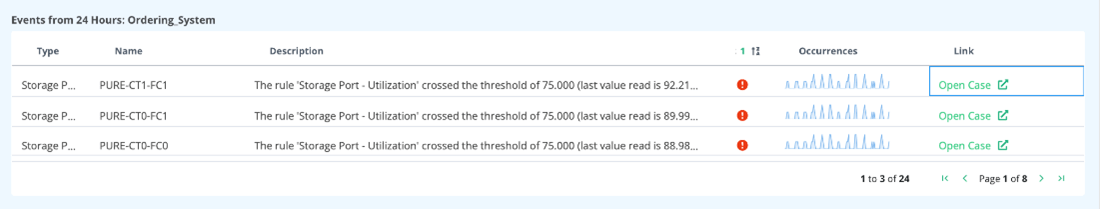
Business Context-Driven Dashboards
Analyze the millions of events generated daily based on business context, detect which parts of your infrastructure support mission-critical applications, and get a health score for each managed application so you can prioritize efforts based on business importance.
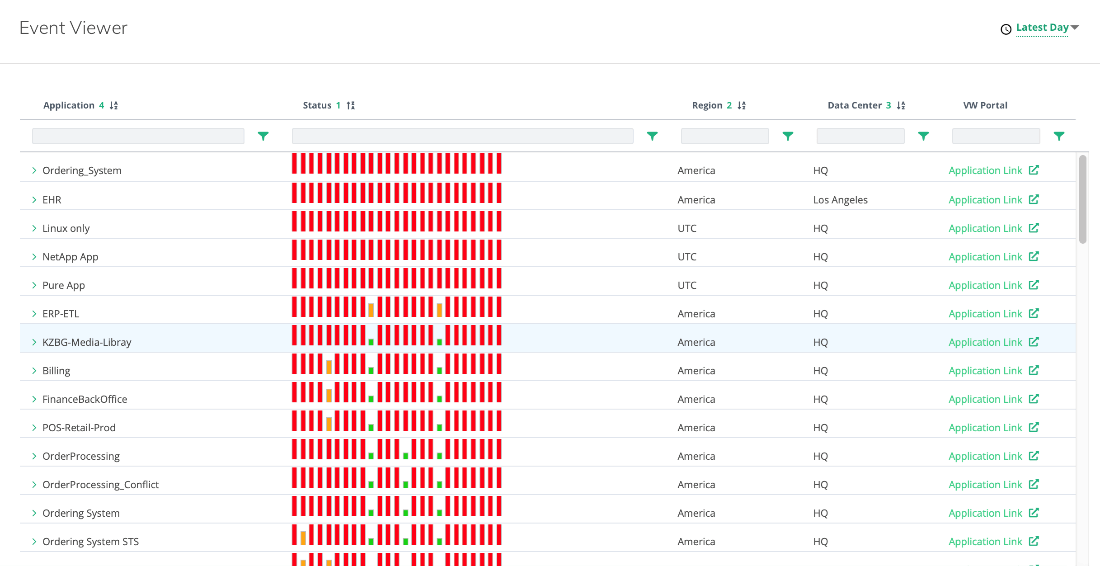
Historical Context
Leverage AIOps to process copious amounts of historical data to identify and predict problematic events, such as a sudden increase in CPU load, enabling proactive remediation before users experience a performance impact.
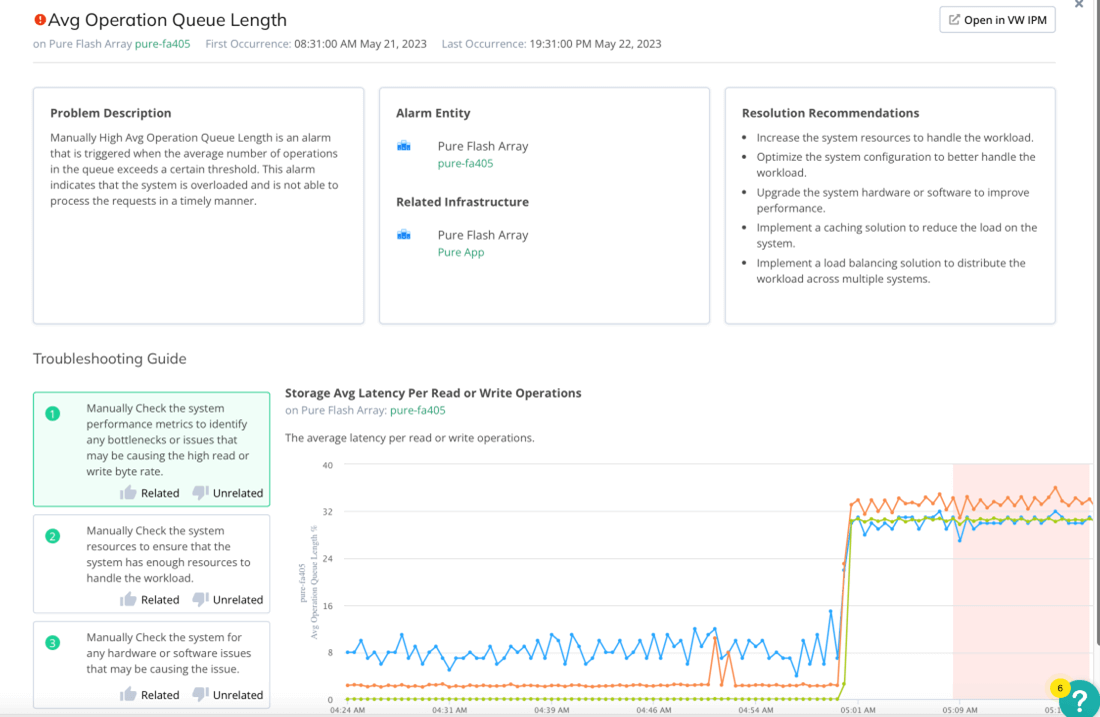
Virtual Troubleshooting Assistance
Use generative AI with out-of-the-box proactive, automated problem identification and probable root-cause analysis to significantly reduce MTTD and MTTR.